You've probably heard that "visual content performs better on social media." That's true, but it's also vague enough to be useless. What specifically about visual quality drives engagement? Is it resolution? Composition? Format? And how much difference does it actually make?
We dug into academic research and platform data to find concrete answers. The short version: image quality affects engagement more than most creators realize, and the mechanisms are more interesting than "better photos look nicer."
Higher resolution leads to more engagement, and we know why
The most direct study on this question comes from Ryu (2024), who ran three experiments specifically testing how image resolution affects social media engagement (in the context of cause-related marketing posts on Instagram).
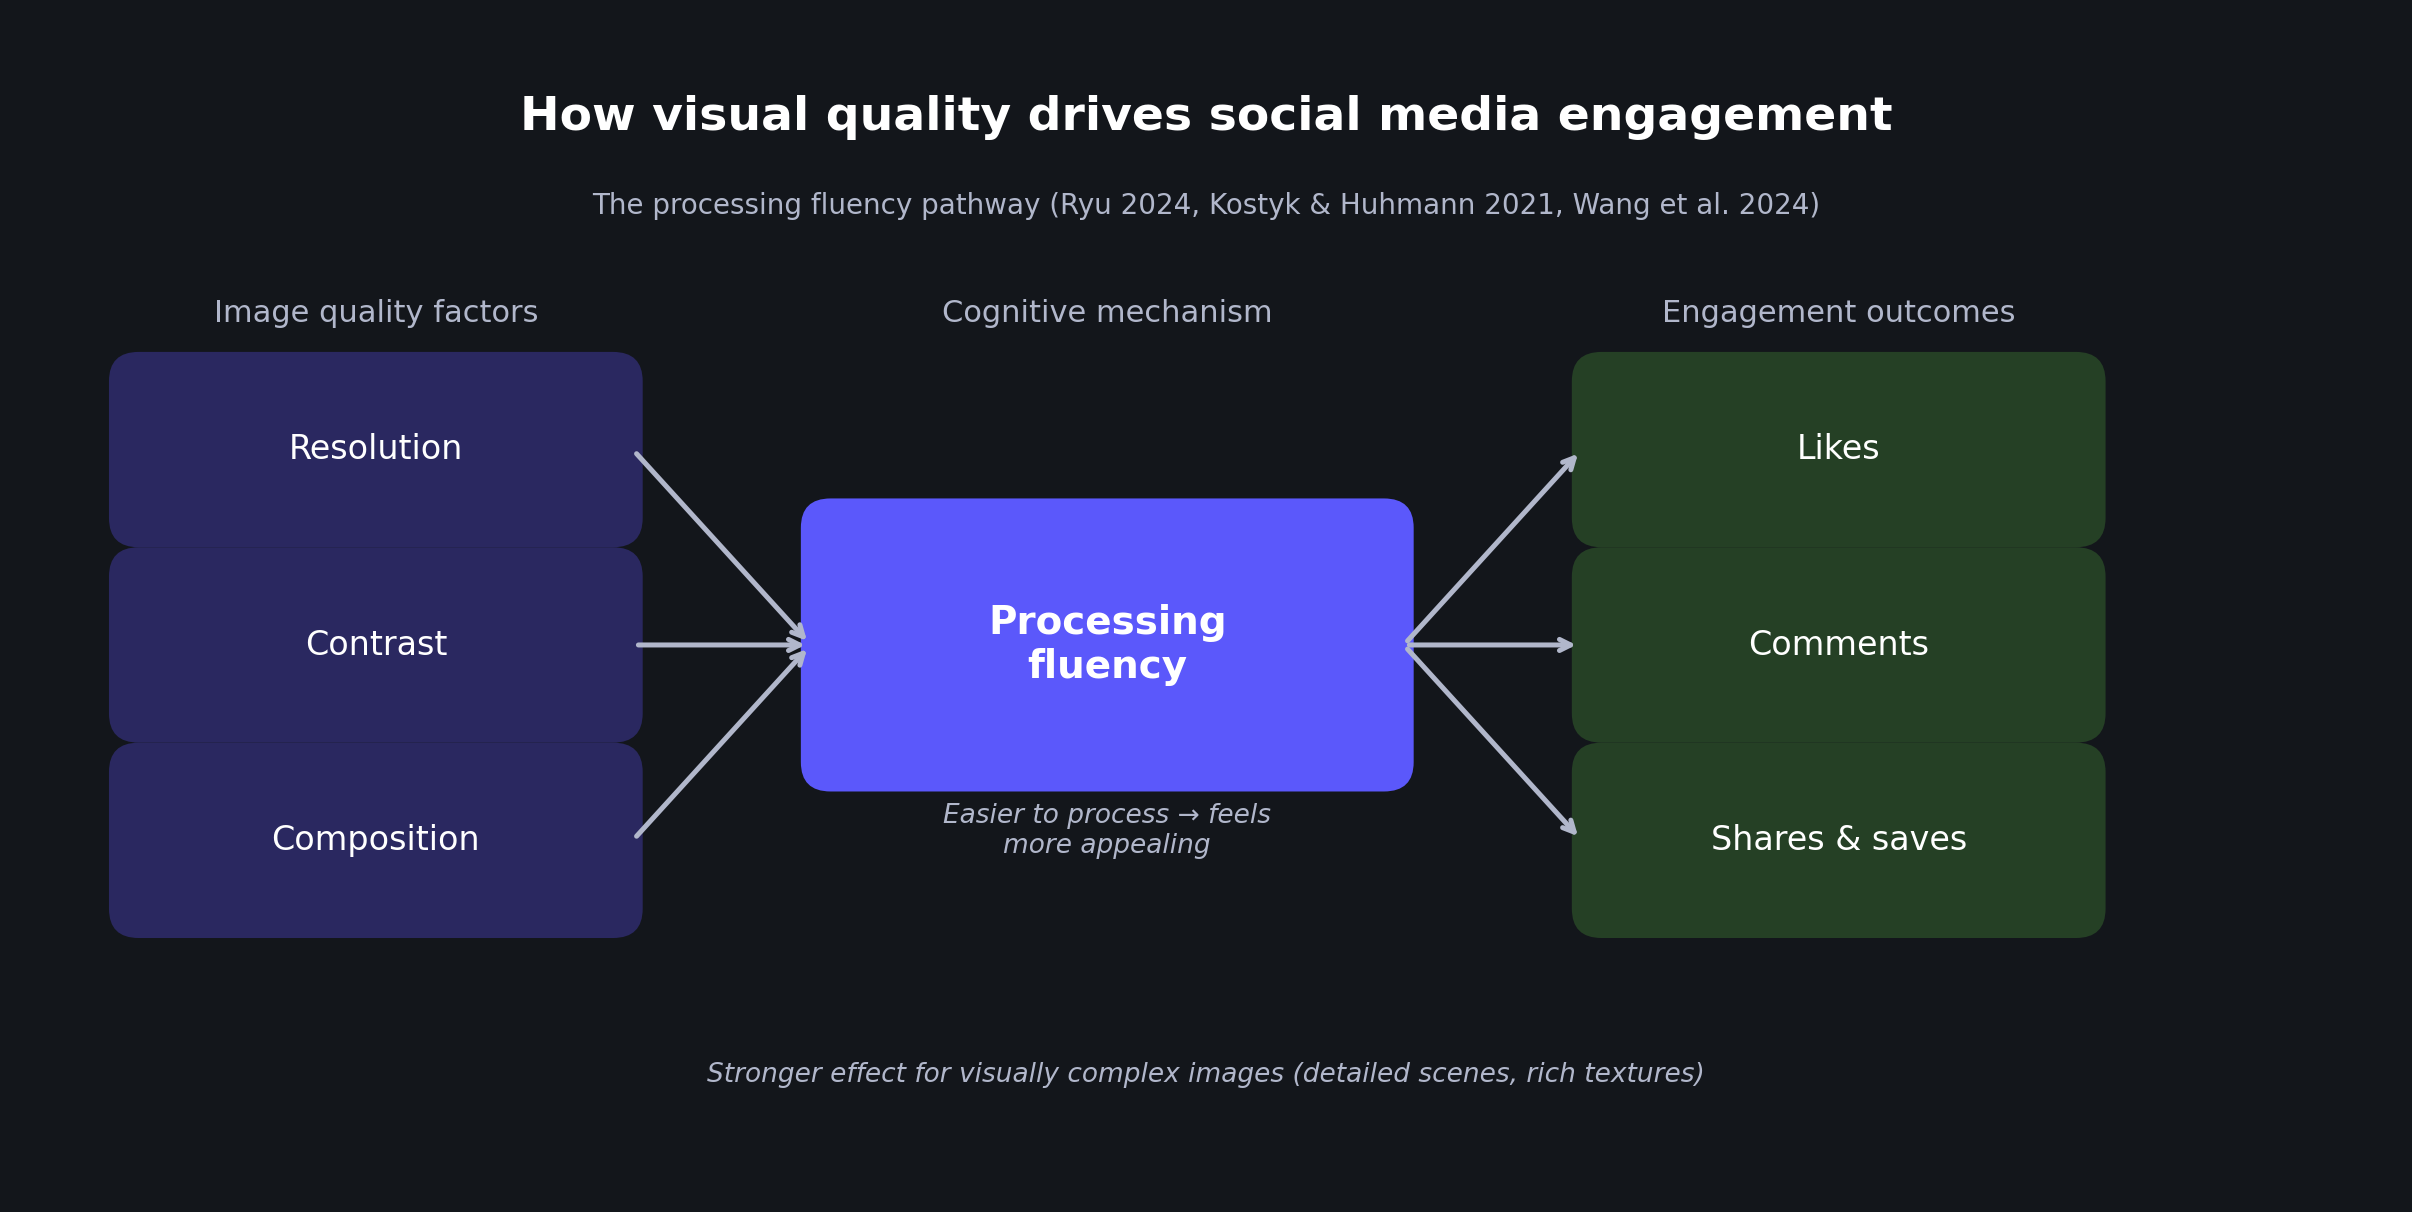
The findings were clear: higher resolution images generated more likes, comments, and shares across all three studies (with sample sizes of 155, 160, and 291 participants respectively). But the more interesting finding was the mechanism. The effect was mediated by processing fluency: higher resolution images are literally easier for our brains to process, which makes them feel more appealing, which increases the likelihood of engagement.
The study also found that the resolution effect was stronger for visually complex images. A simple flat-lay of one product might not benefit as much from higher resolution, but a detailed landscape, a busy street scene, or a portrait with intricate background details gets a significantly larger engagement boost from sharper resolution. For photographers and content creators sharing detailed work, this means resolution isn't just a technical spec. It directly affects how your audience responds.
Composition and contrast matter as much as sharpness
Resolution is one component of visual quality. Kostyk and Huhmann (2021) studied two other components: symmetry and contrast.
Their research combined an experiment with 361 participants and field data from 610 real Instagram posts. Both approaches pointed to the same conclusion: images with symmetric composition and high contrast generated more likes and comments. The mechanism, again, was processing fluency paired with aesthetic pleasure. Symmetric, high-contrast images are easier to process and more visually satisfying, which translates into higher engagement.
This suggests that "image quality" on social media isn't just about pixel count. It's a combination of resolution, contrast, lighting, and composition, all of which affect how easily and pleasurably the viewer processes what they see. A 4K image with muddy contrast and awkward composition may underperform a well-composed 1080p shot.
Visual complexity: more detail helps, more clutter hurts
Wang et al. (2024) analyzed 85,975 images and distinguished between two types of visual complexity. Pixel-level complexity (fine detail, texture richness, image sharpness) increased likes and shares. Object-level complexity (many distinct objects in the frame) had a more nuanced effect, with diminishing returns on engagement.
In practical terms: a richly detailed close-up of a product or a texture-heavy landscape photo performs well because the detail draws the eye. A cluttered scene with too many competing elements performs poorly because the brain struggles to process it. Brightness also played a role, though its effects were mixed: bright, detail-rich images tended to perform best for shares, while the interaction between brightness and clutter was more complex for likes.
This explains why certain types of "high quality" posts outperform others. A sharp, well-lit image with rich detail in a focused composition hits the sweet spot. A sharp image of a messy, cluttered scene doesn't get the same benefit from technical quality alone.
Photos still outperform other formats on Facebook
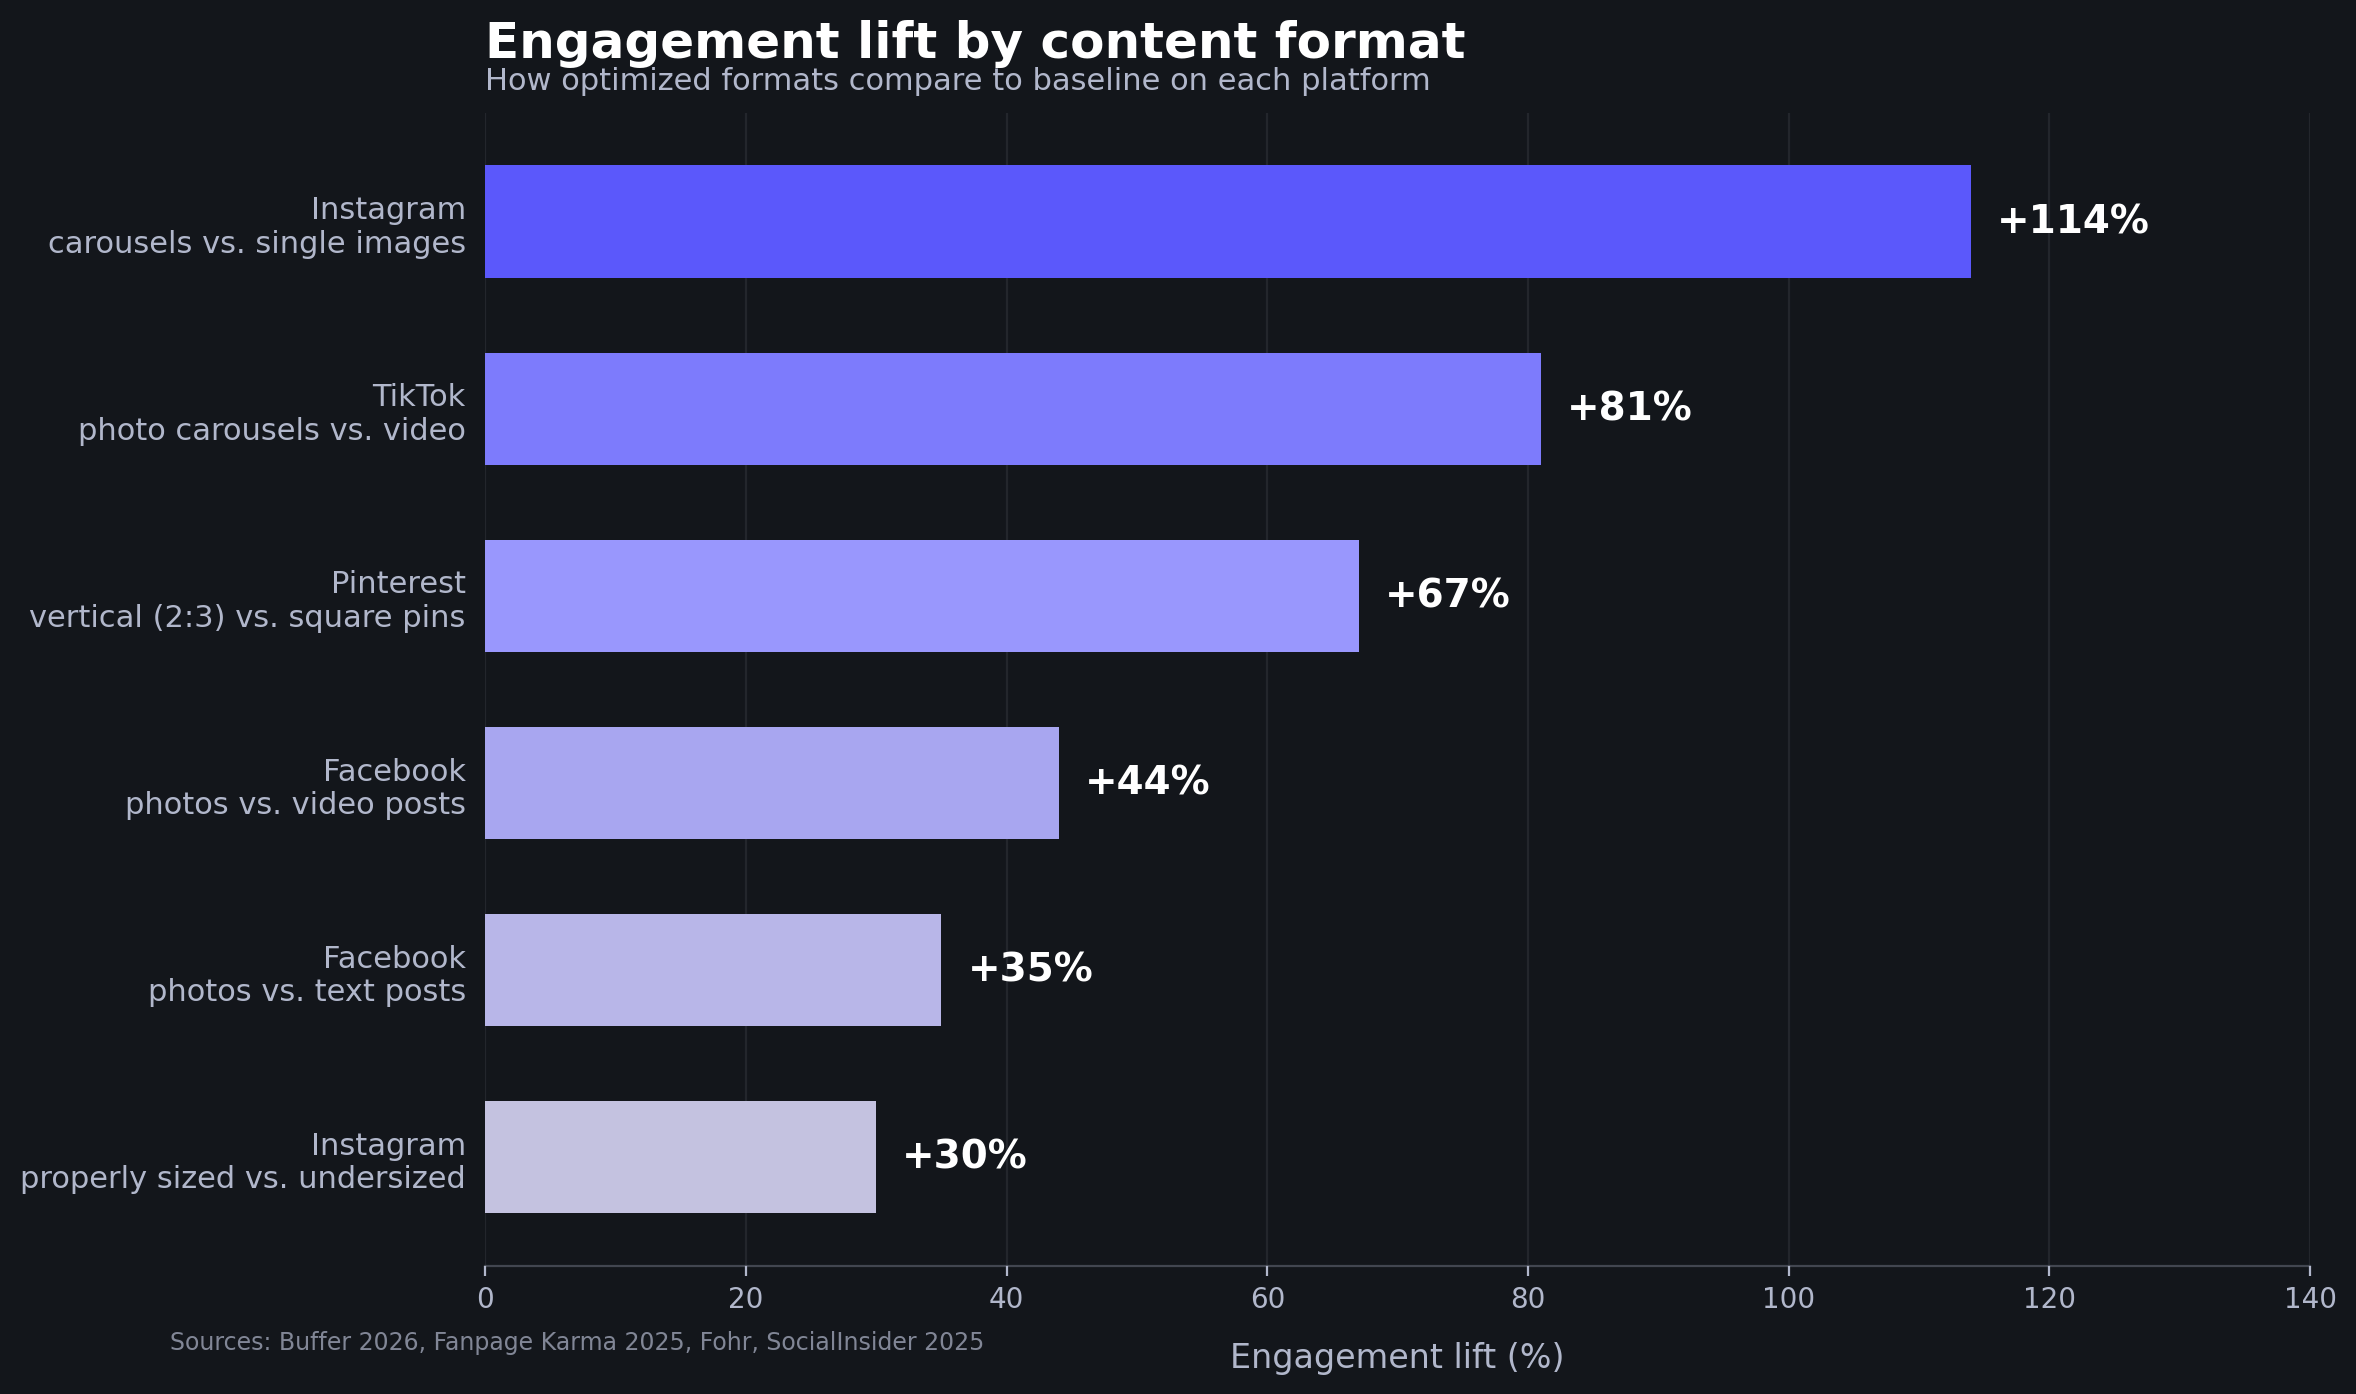
Despite the industry push toward video, photos remain the highest-engagement format on Facebook. According to SocialInsider's 2025–2026 benchmarks (based on 70M+ posts), photo posts generate roughly 35% more engagement than text posts and about 44% more engagement than video posts on the platform.
The average Facebook engagement rate sits around 0.15% (per SocialInsider), which makes any format advantage meaningful. For small businesses and creators using Facebook for marketing, this means a strong photo strategy still outperforms a mediocre video strategy.
Instagram: sizing, carousels, and the algorithm
Instagram is where image quality data is richest. According to data from Fohr, an influencer analytics platform, properly sized images (meeting Instagram's recommended 1080px width and 3:4 or 4:5 aspect ratio) receive roughly 30% more engagement than improperly sized ones.
Instagram's algorithm uses image resolution and clarity as quality signals. The platform recommends a minimum of 1080px width for feed posts. Images uploaded below this threshold get compressed and look soft, which affects both algorithmic distribution and viewer perception.
The format story is equally significant. Buffer's 2026 State of Social report, analyzing over 52 million posts, found that Instagram carousels generate 114% more engagement than single-image posts. Sprout Social's 2025 benchmarks showed Instagram engagement increased 28% year over year, with brands experiencing a 20% jump in inbound engagements.
Carousels work because they combine visual quality with depth: multiple images encourage swiping, which signals engagement to the algorithm, which increases distribution. But each individual image in the carousel still needs to be sharp and well-composed. A carousel of blurry phone photos doesn't get the same boost.
Pinterest: where format compliance drives outsized returns
Pinterest is a visual search engine as much as a social platform, and image format directly affects performance. Vertical pins in 2:3 aspect ratio generate 67% more engagement than square-format pins. The platform recommends a minimum width of 1000 pixels.
With over 550 million monthly active users (as of early 2026) and 83% of weekly users reporting they've purchased based on content seen on Pinterest, the stakes for image quality are commercial, not just social. A photographer or small business posting portfolio work or product shots to Pinterest is competing for attention in a feed where visual quality is the primary differentiator.
TikTok's surprising photo story
TikTok's pivot toward static images and photo carousels is one of the more unexpected platform developments. Data from Fanpage Karma shows that photo carousels on TikTok achieve 81% higher engagement than video posts, with 82% more likes. Separately, Metricool's 2024 TikTok study found an average engagement rate of 6.46% for image and carousel content.
TikTok launched photo grid and carousel-focused features in 2025, signaling a long-term bet on image content alongside its core video format. For creators who've avoided TikTok because they don't produce video, this opens a new high-engagement channel. But the platform's young, visually literate audience has high standards: low-resolution or poorly composed images stand out negatively in a feed of polished content.
LinkedIn: images break through the text wall
LinkedIn is often treated as a text-first platform, but the data suggests otherwise. Posts with images receive approximately 2.3x more engagement than text-only posts. Buffer's 2026 report found that LinkedIn carousels (document posts) achieve a 21.77% engagement rate, the highest of any LinkedIn format.
With over 60% of LinkedIn access happening on mobile, image quality matters more than it might seem. A small, blurry image viewed on a phone screen doesn't just look unprofessional. It gets less engagement than a sharp, properly sized one.
What the academic research adds up to
The academic findings paint a consistent picture through a concept called processing fluency. When an image is higher resolution, better composed, higher contrast, and cleaner, the viewer's brain processes it more easily. That ease of processing creates a positive feeling that translates into engagement behaviors: likes, comments, shares, saves.
This isn't about aesthetics in the abstract "pretty pictures" sense. It's a measurable cognitive effect. Ryu (2024) showed processing fluency mediates the resolution-engagement relationship. Kostyk and Huhmann (2021) showed the same mechanism for symmetry and contrast. Wang et al. (2024) showed that fine-grained visual detail (pixel-level complexity) benefits engagement through the same pathway.
The practical implication: improving image quality isn't just cosmetic. It makes your content cognitively easier to engage with.
What to do about it
The specifics depend on your platform and content type, but a few principles apply across the board.
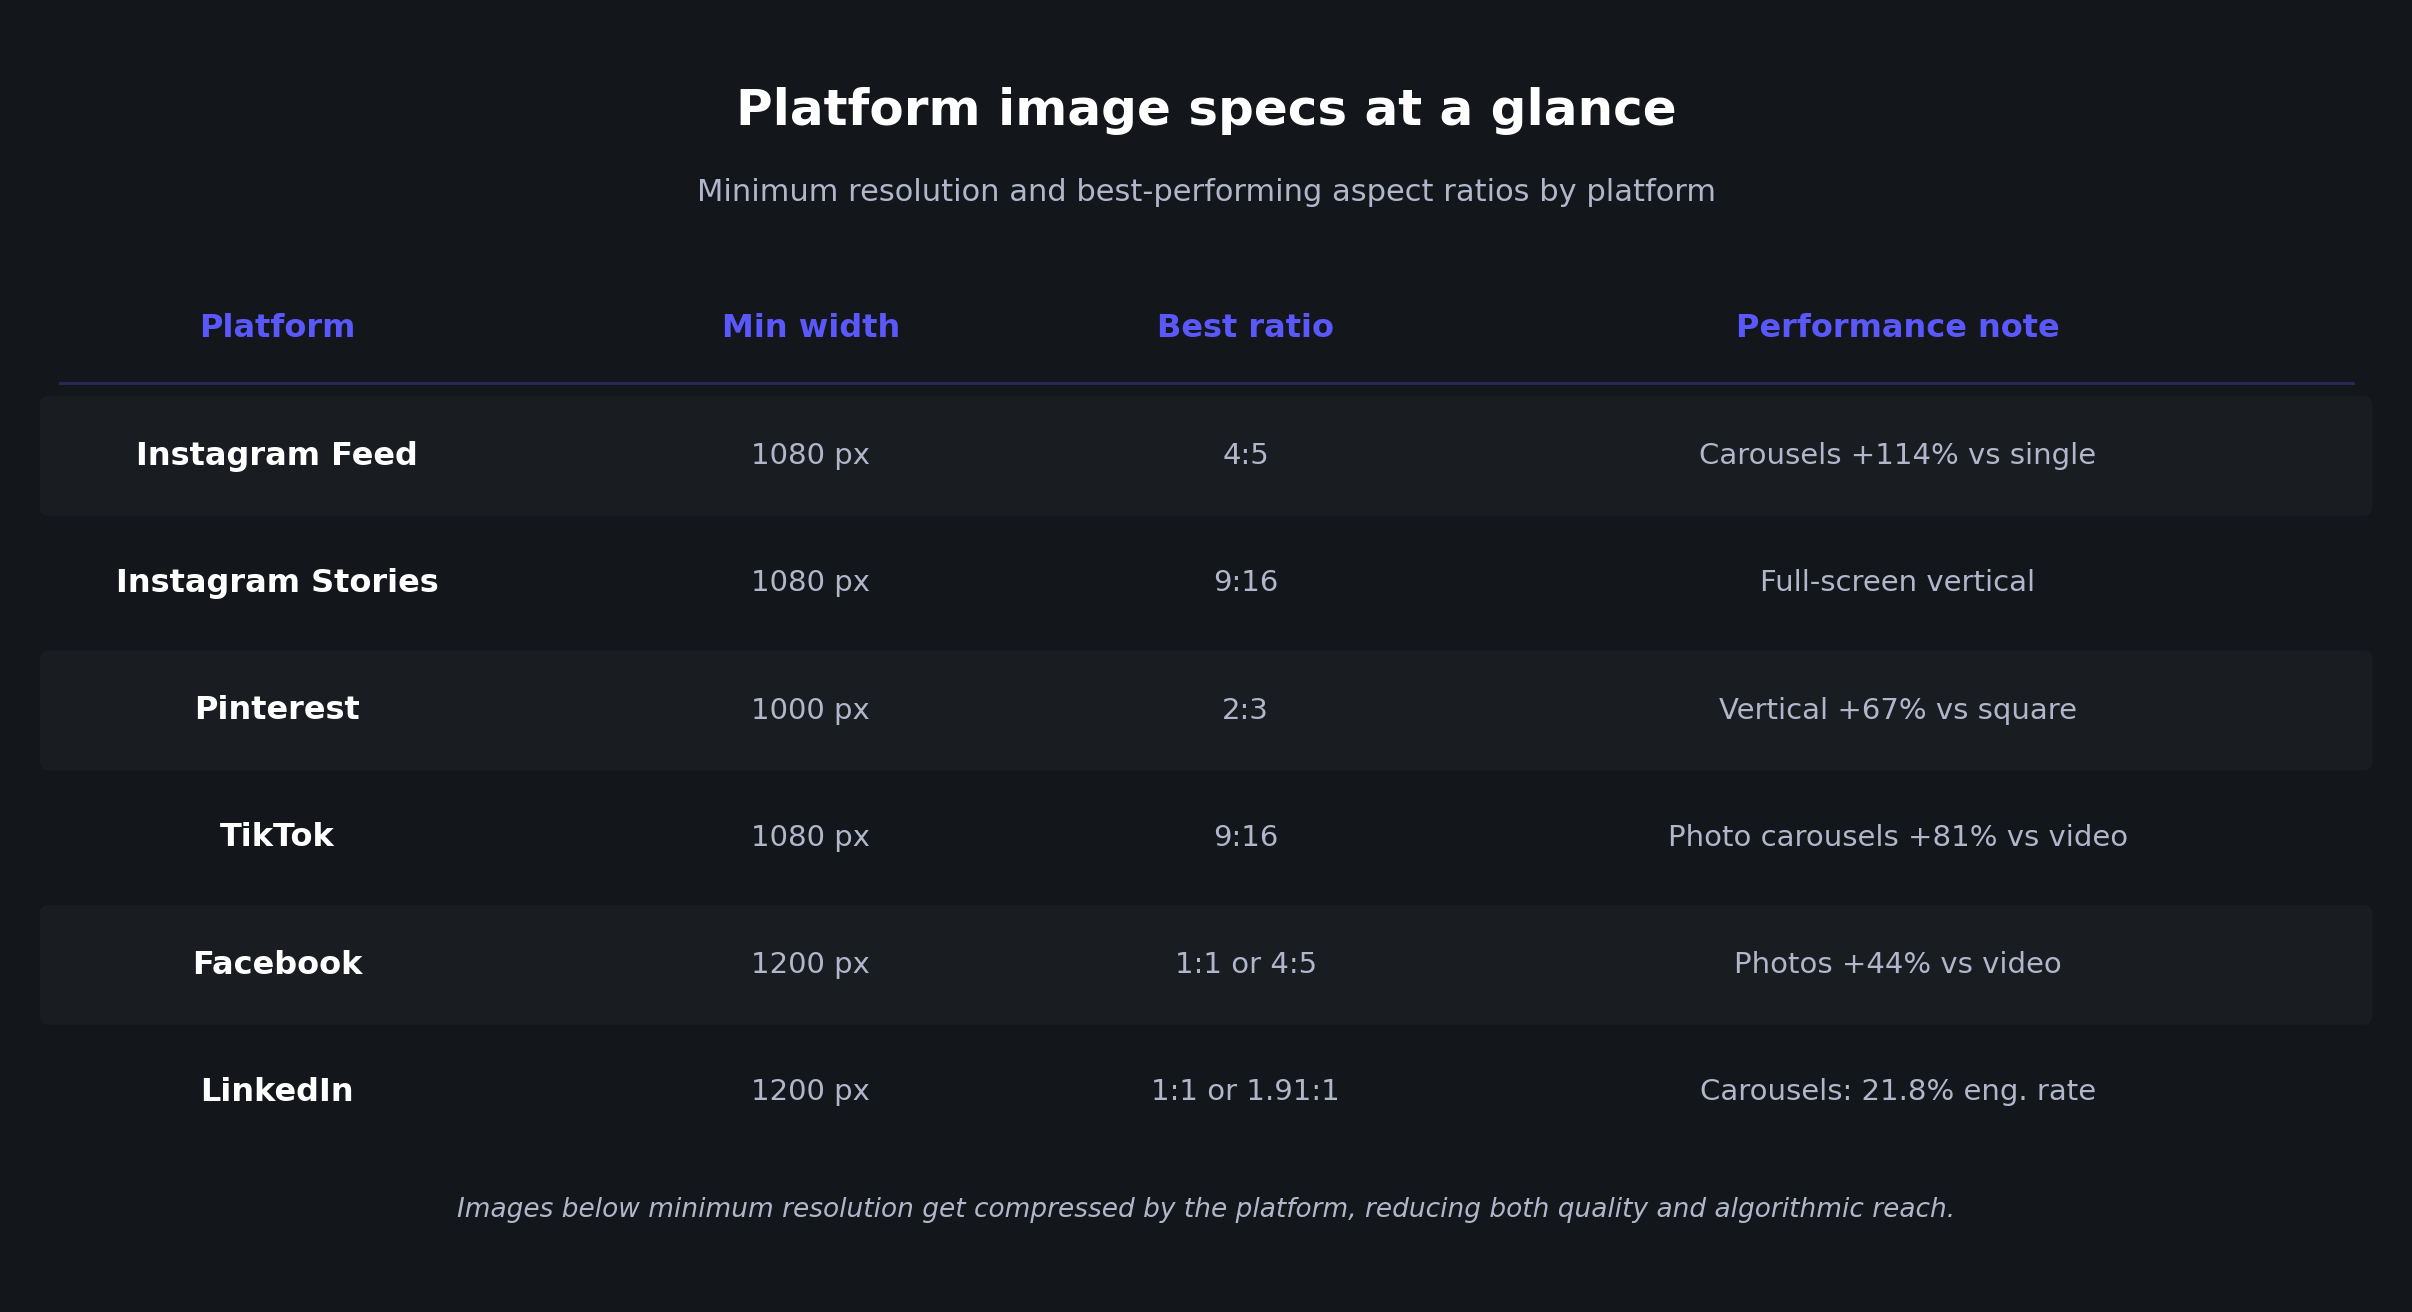
Meet platform resolution requirements. Instagram needs minimum 1080px width. Pinterest needs minimum 1000px. If your source images fall below these thresholds, upscaling brings them to the resolution platforms need without introducing artifacts.
Use platform-native aspect ratios. 4:5 for Instagram feed, 2:3 for Pinterest, 9:16 for Stories and Reels. Properly formatted images get significantly more engagement (up to 67% more on Pinterest).
Prioritize contrast and sharpness. The research shows these affect engagement through processing fluency. If your images look soft or washed out, sharpening and enhancement can improve both without reshooting. For portraits specifically, face enhancement preserves natural skin texture while improving clarity.
Keep compositions clean. Visual detail in your subject helps engagement. Visual clutter across the frame hurts it. When shooting for social, a focused composition with rich detail outperforms a busy scene, even if both are technically sharp.
Don't skip carousels. On Instagram (+114% engagement) and TikTok (+81% engagement), multi-image carousels significantly outperform single images. Each image in the carousel needs to be high quality. If some of your carousel images are lower quality than others, enhancement tools can bring consistency across the set.
The bottom line: social media algorithms and human cognition both reward image quality. Improving the technical quality of your posts isn't a vanity exercise. It's one of the highest-leverage changes you can make to your engagement rates.
Sources
Academic research
- Ryu, S. (2024). From pixels to engagement: Examining the impact of image resolution in cause-related marketing on Instagram. Journal of Research in Interactive Marketing, 18(4), 709-730. DOI: 10.1108/JRIM-08-2023-0262
- Kostyk, A. & Huhmann, B.A. (2021). Perfect social media image posts: Symmetry and contrast influence consumer response. European Journal of Marketing, 55(6), 1747-1779. DOI: 10.1108/EJM-09-2018-0629
- Wang, F., Yue, M., Yuan, Q., & Cao, R. (2024). Differential effects of visual complexity in firm-generated content on consumer engagements: A deep learning approach. Marketing Intelligence & Planning, 42(4), 684-703. DOI: 10.1108/MIP-12-2022-0570
Industry reports and platform data
- Fohr. Instagram image sizing and engagement study (cited via industry sources; original report no longer publicly listed). fohr.co
- Buffer. (2026). The State of Social Media Engagement in 2026 (52M+ posts analyzed). buffer.com/resources/state-of-social-media-engagement-2026
- Sprout Social. (2025). Social media benchmarks and engagement data. sproutsocial.com
- Pinterest. Business resources and creator best practices. business.pinterest.com
- Fanpage Karma. (2025). Performance Check: Carousels vs. Videos (TikTok and Instagram). fanpagekarma.com
- Metricool. (2024). TikTok Study: Data analysis and trend predictions. metricool.com/tiktok-study
- Instagram/Meta. Creator best practices and platform recommendations. creators.instagram.com
- LinkedIn / Buffer / Hootsuite. LinkedIn engagement data by post format. Various sources.
